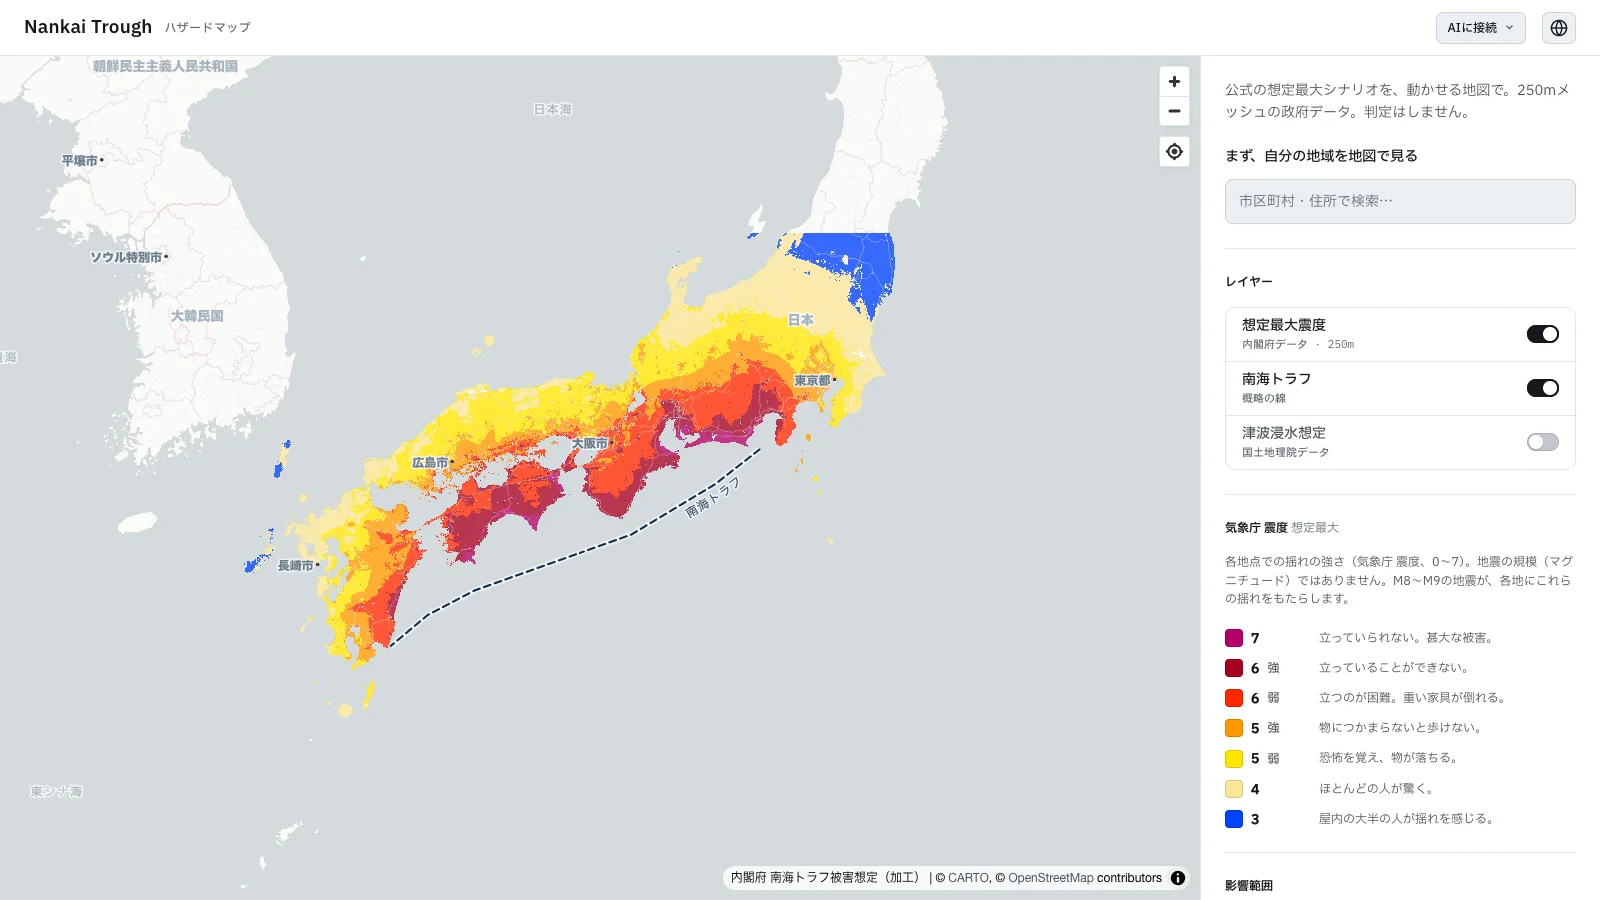
 Nankai Trough hazard map with earthquake intensity layer active
The first time I went on a holiday in Japan, I visited Kochi City. Sleeping at a friend's house there, I noticed something peculiar: everyone slept with their doors open at night. When I asked my friend about it in the morning, he told me that everyone in the area knows a particularly strong earthquake is coming, and that if the doors are closed when it hits, people could be trapped inside. That was my first encounter with the words "Nankai Trough."
Ever since then, I have been extremely careful about earthquakes. Living in Tokyo, I still go into full panic mode when one happens, no matter how small.
I think Japan is amazing, but I noticed a pattern. The further people believe they are from the Nankai Trough, the more relaxed they seem when an earthquake happens. In my opinion, that is not a good thing. The projected shaking intensity for central Tokyo is 6 upper on the JMA scale. That means it is impossible to stay standing.
Because of that, I decided to make the government's own hazard data usable. First as a clean, queryable dataset that stays current as the official figures change, then as a bilingual map anyone can open to find their own area.
The Nankai Trough is a subduction zone off the Pacific coast of Japan. The government projects a magnitude 8-9 earthquake within the next 30 years with roughly 70-80% probability. The official hazard data exists, but it is buried across multiple government PDFs, spreadsheets, and agency websites. If you want to check what the projected shaking intensity is at your address, there is no single place that shows it clearly.
So I built the dataset first. A structured source of truth that pulls the official figures into one place, cites every value, and can be updated when the government revises its projections. It ships as an MCP server, so any AI assistant can query the hazard for a given address. The bilingual map is one view on top of that same data.
Two different datasets sit underneath. Earthquake intensity answers how hard the ground shakes, on the JMA shindo scale, from the Cabinet Office 250-meter mesh. Tsunami inundation answers where water reaches and how deep, from the Geospatial Information Authority, along the coast only. Different source, different unit, different geography. The only thing they share is the single magnitude 8-9 quake that triggers both. Bringing them onto one queryable surface meant reconciling two models that do not naturally line up.
Built as a dataset first
The map was not the starting point. I built a structured dataset: the official figures pulled into one place, every value cited and dated, designed to be updated when the government revises its projections. It ships as an MCP server on npm, so the same source of truth serves both the map and any AI assistant that queries it.
Two datasets merged
Shaking and tsunami are different hazards from different agencies. Earthquake intensity uses the JMA shindo scale (0 to 7) from the Cabinet Office 250-meter mesh. Tsunami inundation uses depth and extent from the Geospatial Information Authority, along the coast only. They share only the quake that triggers them. The map renders each as its own toggle layer, starts with intensity on, and keeps the legend visible so the colors always have meaning.
Government data only
Every number comes from the Cabinet Office (内閣府) or the Geospatial Information Authority of Japan (国土地理院). The dataset does not interpret, score, or editorialize. It carries the official maximum-class scenario exactly as published, and the attribution stays visible at all times.
Bilingual
Japan has over 3 million foreign residents. Earthquake preparedness information is overwhelmingly Japanese-only. The map detects browser language and defaults to English or Japanese, with a toggle to switch. Layer names, the JMA intensity legend, and all interface copy work in both languages.
The dataset ships as an MCP server on npm, nankai-trough-mcp, updatable as the official figures change. The bilingual map that renders it is live at nankaitrough.bymarsel.me. The project was fully built with Claude Code.
npm · nankai-trough-mcp nankaitrough.bymarsel.meI live in Japan. The Nankai Trough earthquake is not hypothetical to me. I wanted to understand the data for myself, and once I did, the gap between the raw government files and what a normal person can actually use felt too wide to leave alone. Data should be easily read visually for better understanding.